Charts on the ProTools Dashboard provide you with basic information at a glance, and you can also quickly tailor the charts to your preferences.
Highlighted Features in Dashboard
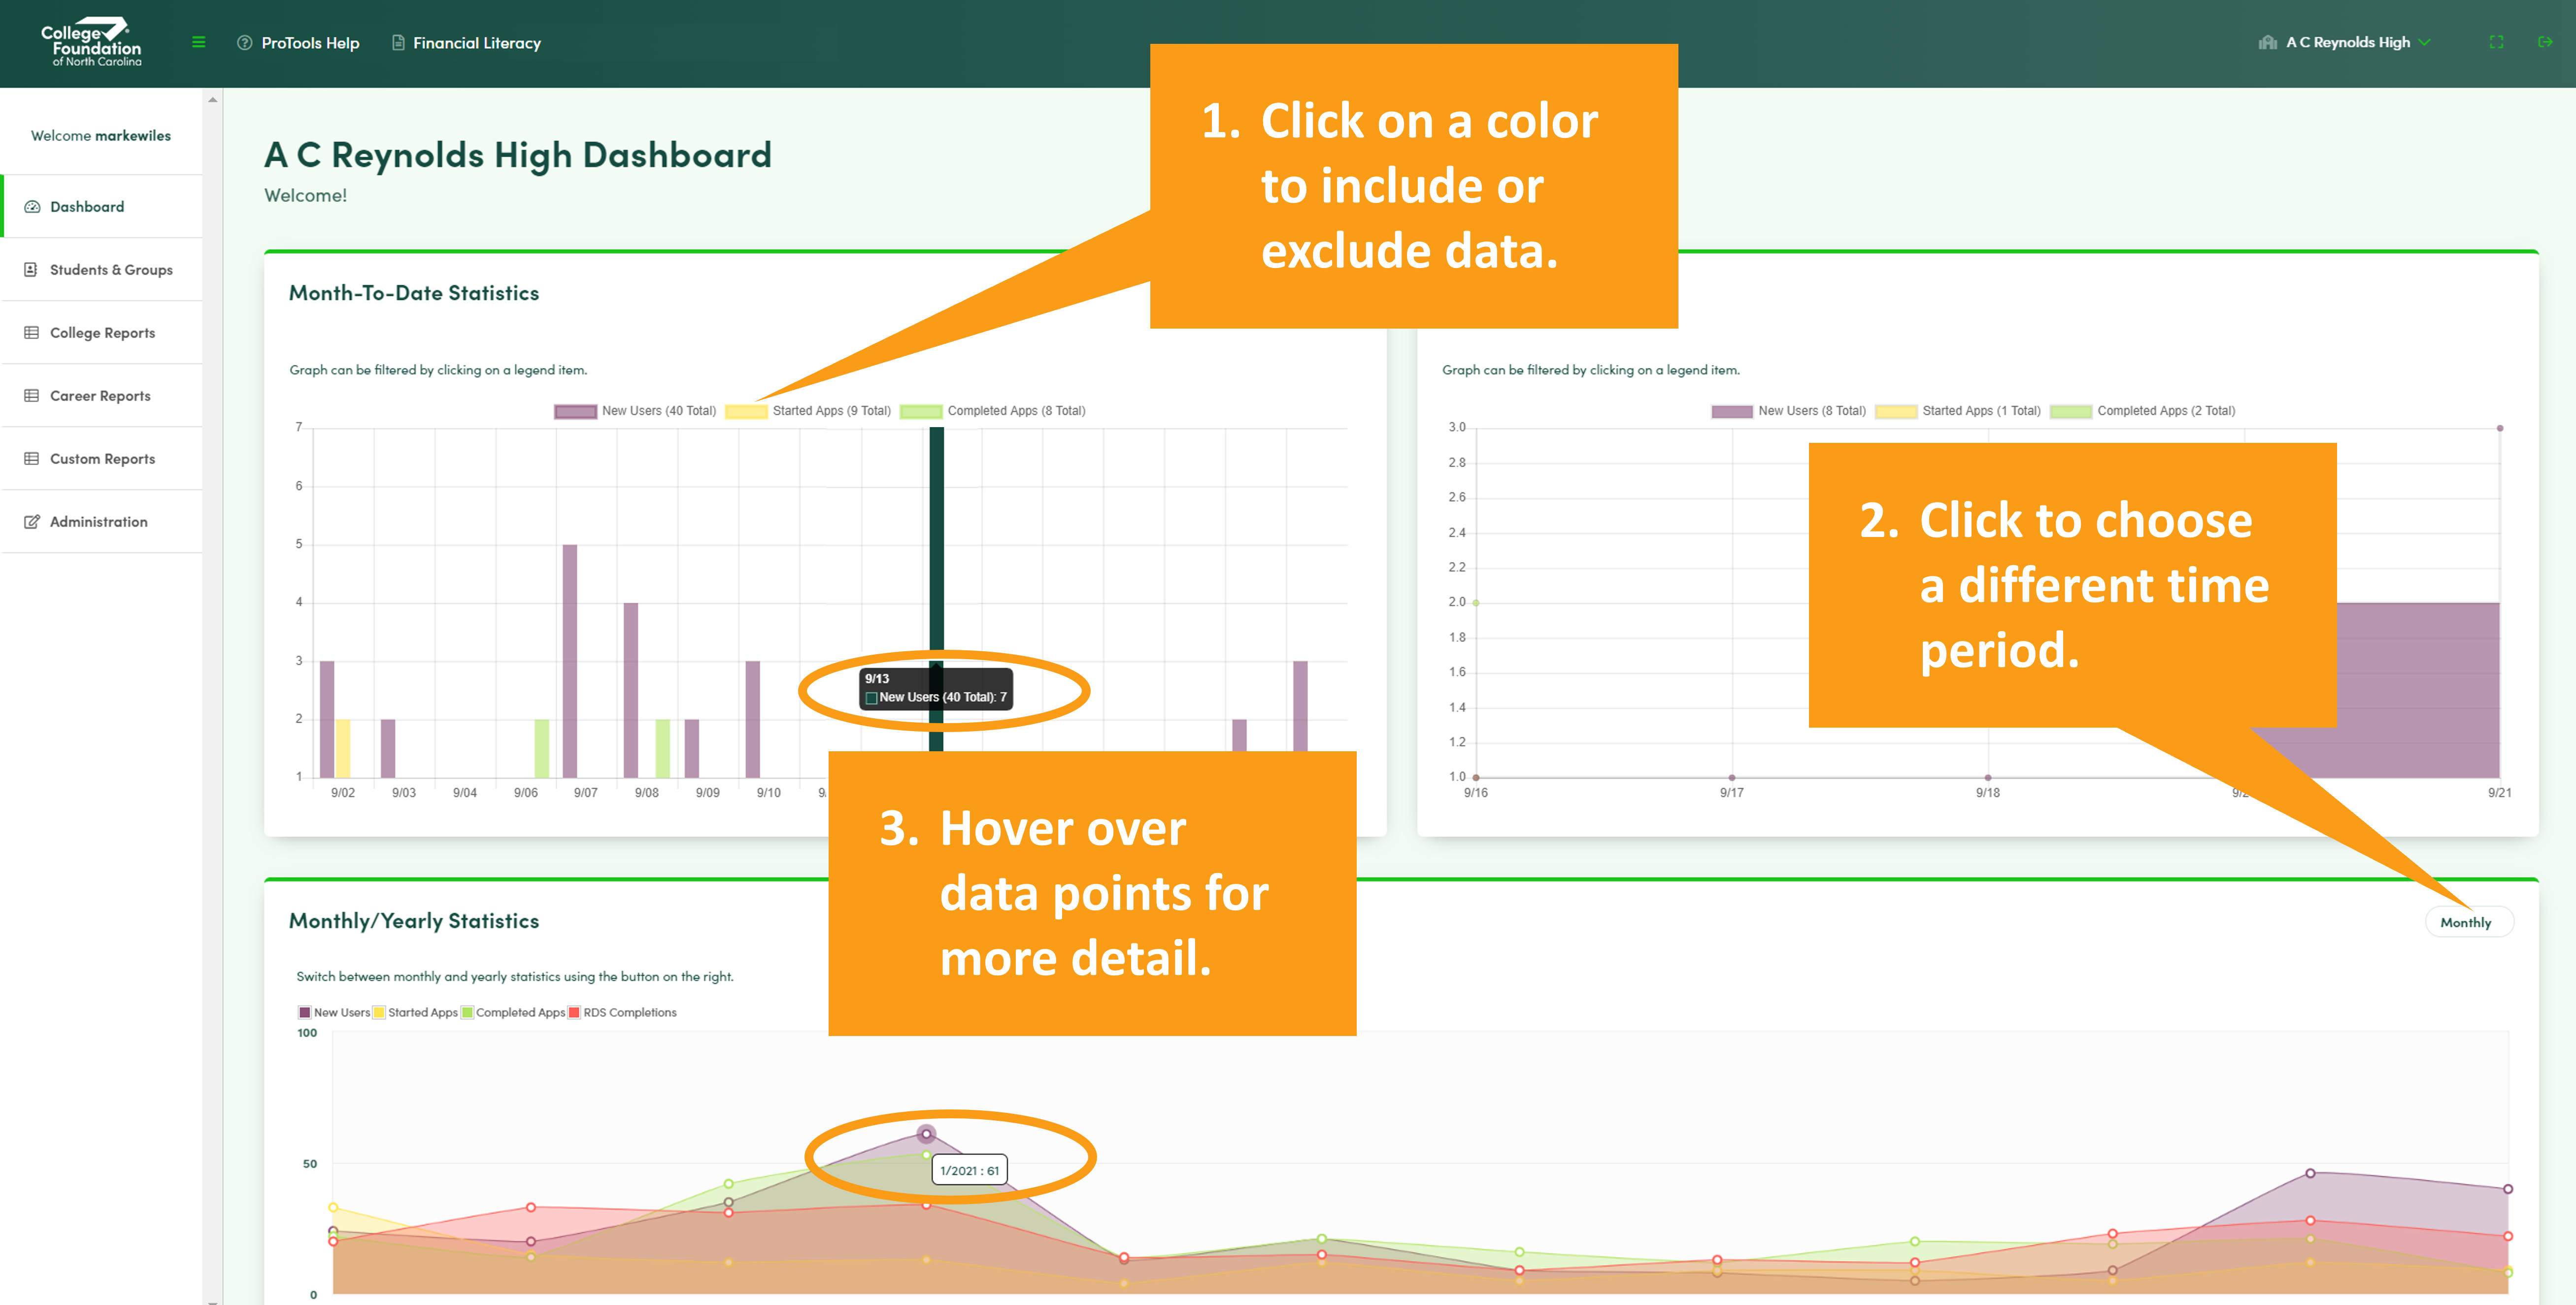
- Data filtering - Some charts allow you to click on a color to include or exclude data.
- Choose time period - Some charts allow you to click and change the time period (such as monthly or yearly).
- Data hover - Hover over bars and data points to see more detail.
Click image to enlarge